Learning Objectives
- Understand the purpose and benefits of the pandas module.
- Be able to open different types of files using the pandas module.
- Be able to download information from an Internet address using the pandas module.
- Be able to look at data using the pandas module.
Contents
- References
- Getting Started Video
- The Pandas Module
- Pandas Data Types
- Getting Data
- Examining Data
- Filtering Data
- Plotting
References
- https://pandas.pydata.org/docs/user_guide/10min.html
- https://pandas.pydata.org/docs/user_guide/dsintro.html
- https://pandas.pydata.org/docs/user_guide/io.html
- https://pandas.pydata.org/docs/user_guide/basics.html
Getting Started Video
I did not make this video, but it is widely recommended for beginners to Pandas. There might be a bit of computer speak in it, but it should get you started with the many facets of Pandas.
The Pandas Module
The pandas module is a high-level module that makes it fairly simple to get, parse, and observe data. Pandas also includes Numpy to perform certain calculations on data.
Pandas is a very large module, and there are many different ways to do the same thing. As such, I will not take the time to rewrite the documentation. User Guide — pandas 1.2.0 documentation (pydata.org)
We can use the pandas module to read different types of files that are locally on a hard drive or via the Internet. Luckily, pandas figures out which to do based on the URI (uniform resource identifier). If you give it something that looks like an Internet address, Pandas will recognize that and go out to get the data.
Pandas Data Types
Pandas can read several different data types using a different read function, which is usually in the form of read_xxx(), such as read_csv(). You can see these functions here: Input/output — pandas 1.2.0 documentation (pydata.org)
Pandas contains essentially two types of containers:
- Series – a 1D list of data, much like an np.array in Numpy
- DataFrame – a 2D list of data, much like a table (rows/columns)
Getting Data
Pandas has several functions that can retrieve data in a specific format from a URI. A URI is a uniform resource identifier. This means that Pandas can get data from a file, from the web, or anywhere else that can be specified. For example, if Pandas sees a URI of something like http://www.data.org/get_data.php, then it knows by http that it will be using the web to get data.
Now we need to let Pandas know how the data is coming packaged. There are several ways data can be packaged for Pandas to understand. They are listed here: IO tools (text, CSV, HDF5, …) — pandas 1.2.3 documentation (pydata.org).

We can grab data by using pandas’ functions, such as read_csv, read_json, or even read_html.
import pandas as pd
data = pd.read_csv("http://web.eecs.utk.edu/~smarz1/courses/cosc505/example.csv")
print (data)

You can see that when I print data, it will give me the row number at the left (0, 1, 2). If we take a look at the actual CSV file, we can see how it is formatted.

So, you can see that Python is displaying 0, 1, and 2 as the row index, but Col 1, Col 2, and Col 3 come from the CSV file directly.
Examining Data
We can now look at the data we just retrieved from the CSV file. Recall that Pandas has two different data types: (1) Series, and (2) DataFrame.
import pandas as pd
data = pd.read_csv("http://web.eecs.utk.edu/~smarz1/courses/cosc505/example.csv")
col1 = data["Col 1"]
print("Data is type", type(data))
print("Col1 is type", type(col1))
print(col1)
The code above prints the following result.

You can see that the 2-dimensional table is a DataFrame, whereas a single column (which is a 1-dimensional array) is a Series. We can also get a row by index. However, we are required to use iloc, which stands for integer location.
import pandas as pd
data = pd.read_csv("http://web.eecs.utk.edu/~smarz1/courses/cosc505/example.csv")
row1 = data.iloc[0]
print("Data is type", type(data))
print("Row1 is type", type(row1))
print(row1)
Now, we specify the row based on index using iloc.
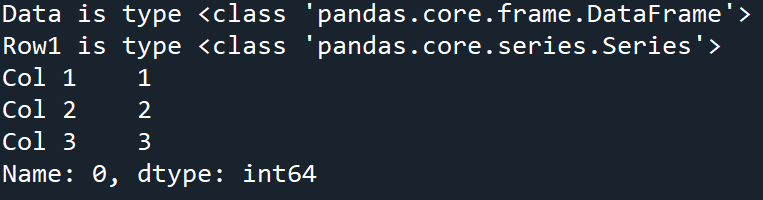
Since iloc retrieves a row, sometimes it will be helpful to grab a column by index as well. This case, we tell Python to “Grab all rows and filter the data by the column index”.
import pandas as pd
data = pd.read_csv("http://web.eecs.utk.edu/~smarz1/courses/cosc505/example.csv")
col1 = data.iloc[:, 0]
print("Data is type", type(data))
print("Col1 is type", type(col1))
print(col1)

The syntax looks a little weird, but we can step through data.iloc[:, 0] and see what’s happening. First, if we don’t specify the comma, then we get the row. Recall that with a list or string, :, is a slice, and is the same as specifying [0:len(x)]. In other words, it will get every row. Then, after the comma, this is known as a filter. We are filtering each row to only give us column index 0.
Filtering Data
Notice that we can use iloc to grab an entire row, which then becomes a Series (1-d). However, sometimes we want to just get portions of a column. We can filter the data using indices or we can do it by using comparisons.
Filtering By Index
We can specify further ranges to our series to get certain data. For example, if we want a particular column in a particular row, we can specify the row and column:
import pandas as pd
import numpy as np
data = pd.read_csv("http://web.eecs.utk.edu/~smarz1/courses/cosc505/example.csv")
row1col1 = data.iloc[1, 1]
print("Data is type", type(data))
print("Row1Col1 is type", type(row1col1))
print(row1col1)

Notice that the first index into iloc is the row number, and the second number following the comma is the column. Also notice that when I get an entire row or column, we are given a Series. Otherwise, we are given a single integer. Lastly, notice that Pandas is using numpy’s data types to store data in a DataFrame or Series.
Filtering By Condition
We can also filter data based on some sort of condition. For example, if we only want rows where the first value is odd, we can do something like this.
import pandas as pd
data = pd.read_csv("http://web.eecs.utk.edu/~smarz1/courses/cosc505/example.csv")
filtered_row = data[(data.iloc[:,0] % 2 != 0)]
print("Data is type", type(data))
print("filtered_row is type", type(filtered_row))
print(filtered_row)
You can see that our condition is inside parentheses which is inside square brackets from the DataFrame. Also recall that data.iloc[:,0] will retrieve the first column. So, in this case, we are dividing the first column’s value by 2 and only accepting it if the remainder is not 0. This means that the value in the first column is odd.

Notice that this skips row 1 because it starts with the value 4, which fails the filter comparison.
Plotting
Pandas works with matplotlib and can generate plots.
import pandas as pd
import numpy as np
import matplotlib.pyplot as plt

ts = pd.Series(np.random.randn(1000), index=pd.date_range("1/1/2000", periods=1000))
ts = ts.cumsum()
df = pd.DataFrame(np.random.randn(1000, 4), index=ts.index, columns=list("ABCD"))
df = df.cumsum()
plt.figure();
df.plot();
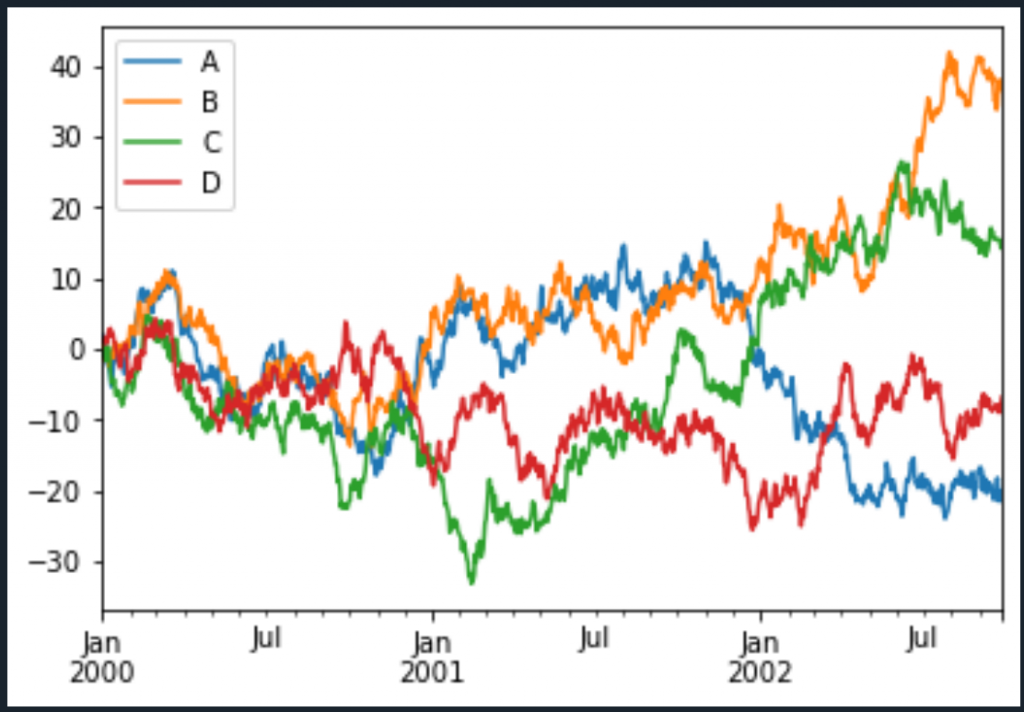
You can see from the code above, we can generate a plot using Pandas. Notice that the only thing that we use matplotlib for in this case is plt.figure(). This makes it nice and easy to generate a plot directly from Panda’s DataFrame (2D) or Series (1D).